Volatility Foundation Volatility Framework 2.6 Usage: Volatility - A memory forensics analysis platform.
Options: -h, --help list all available options and their default values. Default values may be setin the configuration file (/etc/volatilityrc) --conf-file=.volatilityrc User based configuration file -d, --debugDebug volatility --plugins=PLUGINS Additional plugin directories to use (semi-colon separated) --infoPrint information about all registered objects --cache-directory=C:\Users\1762326648/.cache\volatility Directory where cache files are stored --cache Use caching --tz=TZ Sets the (Olson) timezone for displaying timestamps using pytz (if installed) or tzset -f FILENAME, --filename=FILENAME Filename to use when opening an image --profile=WinXPSP2x86 Name of the profile to load (use --infoto see a list of supported profiles) -l LOCATION, --location=LOCATION A URN location from which to load an address space -w, --write Enable write support --dtb=DTB DTB Address --shift=SHIFT Mac KASLR shift address --output=text Output in this format (support is module specific, see the Module Output Options below) --output-file=OUTPUT_FILE Write output in this file -v, --verbose Verbose information -g KDBG, --kdbg=KDBG Specify a KDBG virtual address (Note: for 64-bit Windows 8 and above this is the address of KdCopyDataBlock) --force Force utilization of suspect profile -k KPCR, --kpcr=KPCR Specify a specific KPCR address --cookie=COOKIE Specify the address of nt!ObHeaderCookie (valid for Windows 10 only)
Supported Plugin Commands:
amcache Print AmCache information apihooks Detect API hooks in process and kernel memory atoms Print session and window station atom tables atomscan Pool scanner for atom tables auditpol Prints out the Audit Policies from HKLM\SECURITY\Policy\PolAdtEv bigpools Dump the big page pools using BigPagePoolScanner bioskbd Reads the keyboard buffer from Real Mode memory cachedump Dumps cached domain hashes from memory callbacks Print system-wide notification routines clipboard Extract the contents of the windows clipboard cmdline Display process command-line arguments cmdscan Extract command history by scanning for _COMMAND_HISTORY connections Print list of open connections [Windows XP and 2003 Only] connscan Pool scanner for tcp connections consoles Extract command history by scanning for _CONSOLE_INFORMATION crashinfo Dump crash-dump information deskscan Poolscaner for tagDESKTOP (desktops) devicetree Show device tree dlldump Dump DLLs from a process address space dlllist Print list of loaded dlls for each process driverirp Driver IRP hook detection drivermodule Associate driver objects to kernel modules driverscan Pool scanner for driver objects dumpcerts Dump RSA private and public SSL keys dumpfiles Extract memory mapped and cached files dumpregistry Dumps registry files out to disk editbox Displays information about Edit controls. (Listbox experimental.) envars Display process environment variables eventhooks Print details on windows event hooks evtlogs Extract Windows Event Logs (XP/2003 only) filescan Pool scanner for file objects gahti Dump the USER handle type information gditimers Print installed GDI timers and callbacks gdt Display Global Descriptor Table getservicesids Get the names of services in the Registry and return Calculated SID getsids Print the SIDs owning each process handles Print list of open handles for each process hashdump Dumps passwords hashes (LM/NTLM) from memory hibinfo Dump hibernation file information hivedump Prints out a hive hivelist Print list of registry hives. hivescan Pool scanner for registry hives hpakextract Extract physical memory from an HPAK file hpakinfo Info on an HPAK file idt Display Interrupt Descriptor Table iehistory Reconstruct Internet Explorer cache / history imagecopy Copies a physical address space out as a raw DD image imageinfo Identify information for the image impscan Scan for calls to imported functions joblinks Print process job link information kdbgscan Search forand dump potential KDBG values kpcrscan Search forand dump potential KPCR values ldrmodules Detect unlinked DLLs lsadump Dump (decrypted) LSA secrets from the registry machoinfo Dump Mach-O file format information malfind Find hidden and injected code mbrparser Scans forand parses potential Master Boot Records (MBRs) memdump Dump the addressable memory for a process memmap Print the memory map messagehooks List desktop and thread window message hooks mftparser Scans forand parses potential MFT entries moddump Dump a kernel driver to an executable file sample modscan Pool scanner for kernel modules modules Print list of loaded modules multiscan Scan for various objects at once mutantscan Pool scanner for mutex objects notepad List currently displayed notepad text objtypescan Scan for Windows object type objects patcher Patches memory based on page scans poolpeek Configurable pool scanner plugin printkey Print a registry key, and its subkeys and values privs Display process privileges procdump Dump a process to an executable file sample pslist Print all running processes by following the EPROCESS lists psscan Pool scanner for process objects pstree Print process list as a tree psxview Find hidden processes with various process listings qemuinfo Dump Qemu information raw2dmp Converts a physical memory sample to a windbg crash dump screenshot Save a pseudo-screenshot based on GDI windows servicediff List Windows services (ala Plugx) sessions List details on _MM_SESSION_SPACE (user logon sessions) shellbags Prints ShellBags info shimcache Parses the Application Compatibility Shim Cache registry key shutdowntime Print ShutdownTime of machine from registry sockets Print list of open sockets sockscan Pool scanner for tcp socket objects ssdt Display SSDT entries strings Match physical offsets to virtual addresses (may take a while, VERY verbose) svcscan Scan for Windows services symlinkscan Pool scanner for symlink objects thrdscan Pool scanner for thread objects threads Investigate _ETHREAD and _KTHREADs timeliner Creates a timeline from various artifacts in memory timers Print kernel timers and associated module DPCs truecryptmaster Recover TrueCrypt 7.1a Master Keys truecryptpassphrase TrueCrypt Cached Passphrase Finder truecryptsummary TrueCrypt Summary unloadedmodules Print list of unloaded modules userassist Print userassist registry keys and information userhandles Dump the USER handle tables vaddump Dumps out the vad sections to a file vadinfo Dump the VAD info vadtree Walk the VAD tree and display in tree format vadwalk Walk the VAD tree vboxinfo Dump virtualbox information verinfo Prints out the version information from PE images vmwareinfo Dump VMware VMSS/VMSN information volshell Shell in the memory image windows Print Desktop Windows (verbose details) wintree Print Z-Order Desktop Windows Tree wndscan Pool scanner for window stations yarascan Scan process or kernel memory with Yara signatures
比较重要的参数
1
2
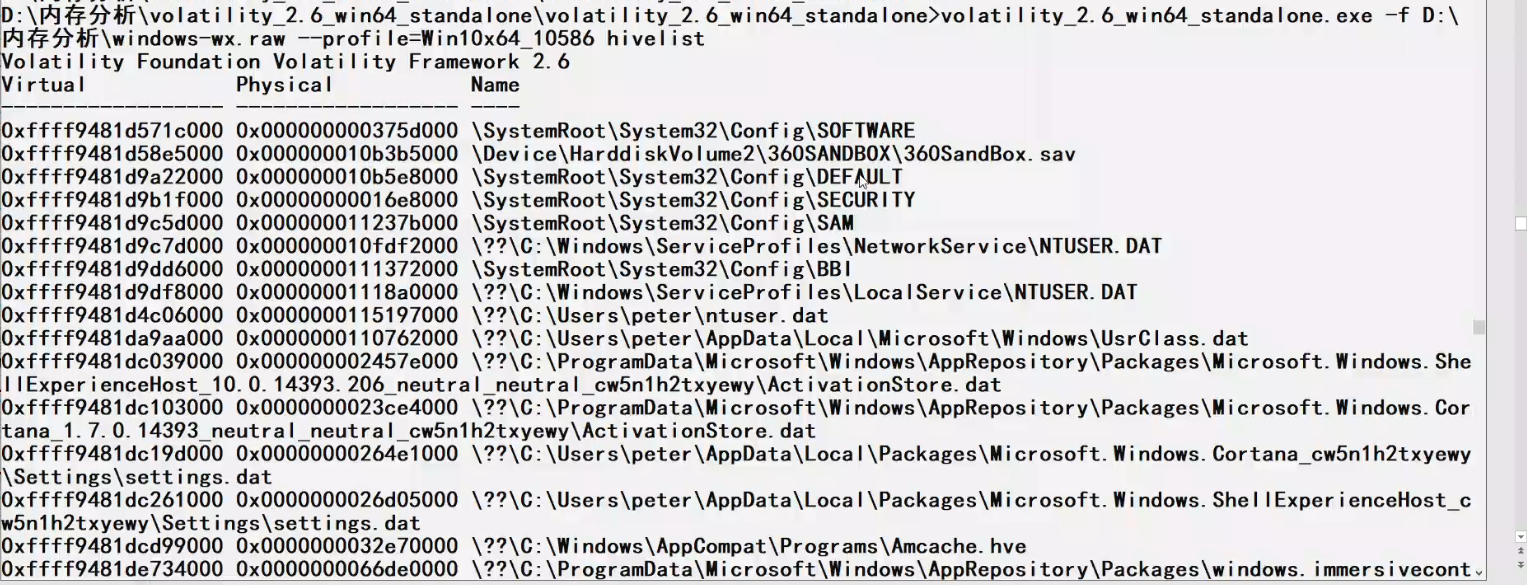
-f FILENAME, --filename=FILENAME
                        Filename to use when opening an image